Claira
Product Design
2024

Enterprise Intelligence Platform with Secure Integration
Claira securely integrates internal and external data for innovation teams within enterprise firewalls, eliminating security-efficiency trade-offs. Our vertical relationship visualization helps users understand complex connections, reducing research time by 34% and increasing insights by 29% while maintaining full data security and compliance.
Team Composition:
1 Product Manager
1 Designer (Me 🦔)
2 Engineers
Key Responsibilities:
Led user research, workflow design, and interface design for core features, including search system and insight generation
Collaborated with engineers to design visualizations of data analysis results
Designed and implemented user testing to validate the platform's core value proposition of increased efficiency

Research & Problem Discovery
Identifying the Problem
After observing innovation teams' workflows in depth, we discovered that researchers spend on average 28% of their overall process time searching for information rather than innovating. More challenging still, critical data is scattered across internal enterprise systems and external online resources, without a secure and consistent integration method.
Fragmented Information Ecosystem
Internal and external data systems exist in separate silos, creating both search inefficiency and information trust gaps. Teams struggle to navigate disconnected resources while simultaneously questioning the reliability and context of sources they find.
Security-Innovation Dilemma
To protect sensitive information and maintain compliance, enterprises cannot leverage external AI tools like ChatGPT or Perplexity with their internal data, forcing teams to choose between security and innovation capabilities.
Manual Research Burden
The lack of automation tools forces researchers to spend excessive time on low-value activities—collecting, filtering, and organizing data—rather than on analysis and innovation, significantly extending the early research phase.
Data-to-Insight Transformation Gap
Even after successful data collection, teams face significant challenges in connecting disparate information points into meaningful patterns and actionable insights that can drive innovation decisions.

Rethinking Search: Why Does the Search Format Need Redesigning?
We observed that current search tools—whether browsers, multi-platform systems, or generative AI tools—have "forms" of information expression that struggle to support innovation teams' needs.
Form 1: Multi-window Retrieval
Information is scattered across multiple tabs, lacking integration and thematic connections, hindering researchers from building systematic perspectives
Form 2: Linear List Presentation
While they can integrate public data, results are mostly linear summaries that can't explore potential connections between data, nor incorporate internal enterprise data
The problem isn't just low search efficiency, but that the "form" of search itself is no longer suitable for enterprise research environments that require high trust, cross-system capabilities, and sensitive data processing. This insight led us to explore a fundamentally different approach: a thematic relationship graph that could visually connect concepts across data sources while maintaining clear boundaries between internal and external information.
Workflow Pain Points
Traditional research workflows trap innovation teams in a cycle of fragmented search, manual file handling, and repetitive prompt engineering. This disjointed process forces researchers to spend more time managing information than analyzing it, creating significant bottlenecks between questions and insights.
Current workflow

Pain Points: fragmented search, manual file handling, and repetitive prompt engineering.
Pain Points: fragmented search, manual file handling, and repetitive prompt engineering.
Current workflow
Claira eliminates these pain points through a unified workflow that handles source complexity behind the scenes. By replacing eight manual steps with four integrated ones, researchers can direct their cognitive resources toward discovering meaningful patterns rather than juggling files and formats—accelerating the journey from curiosity to actionable innovation.
Claira workflow
Project Highlights

34%
Reduction in time spent searching for information
29%
Decrease in time needed to process and understand data
17%
Higher utilization rate of insights in final reports
Impact Metrics
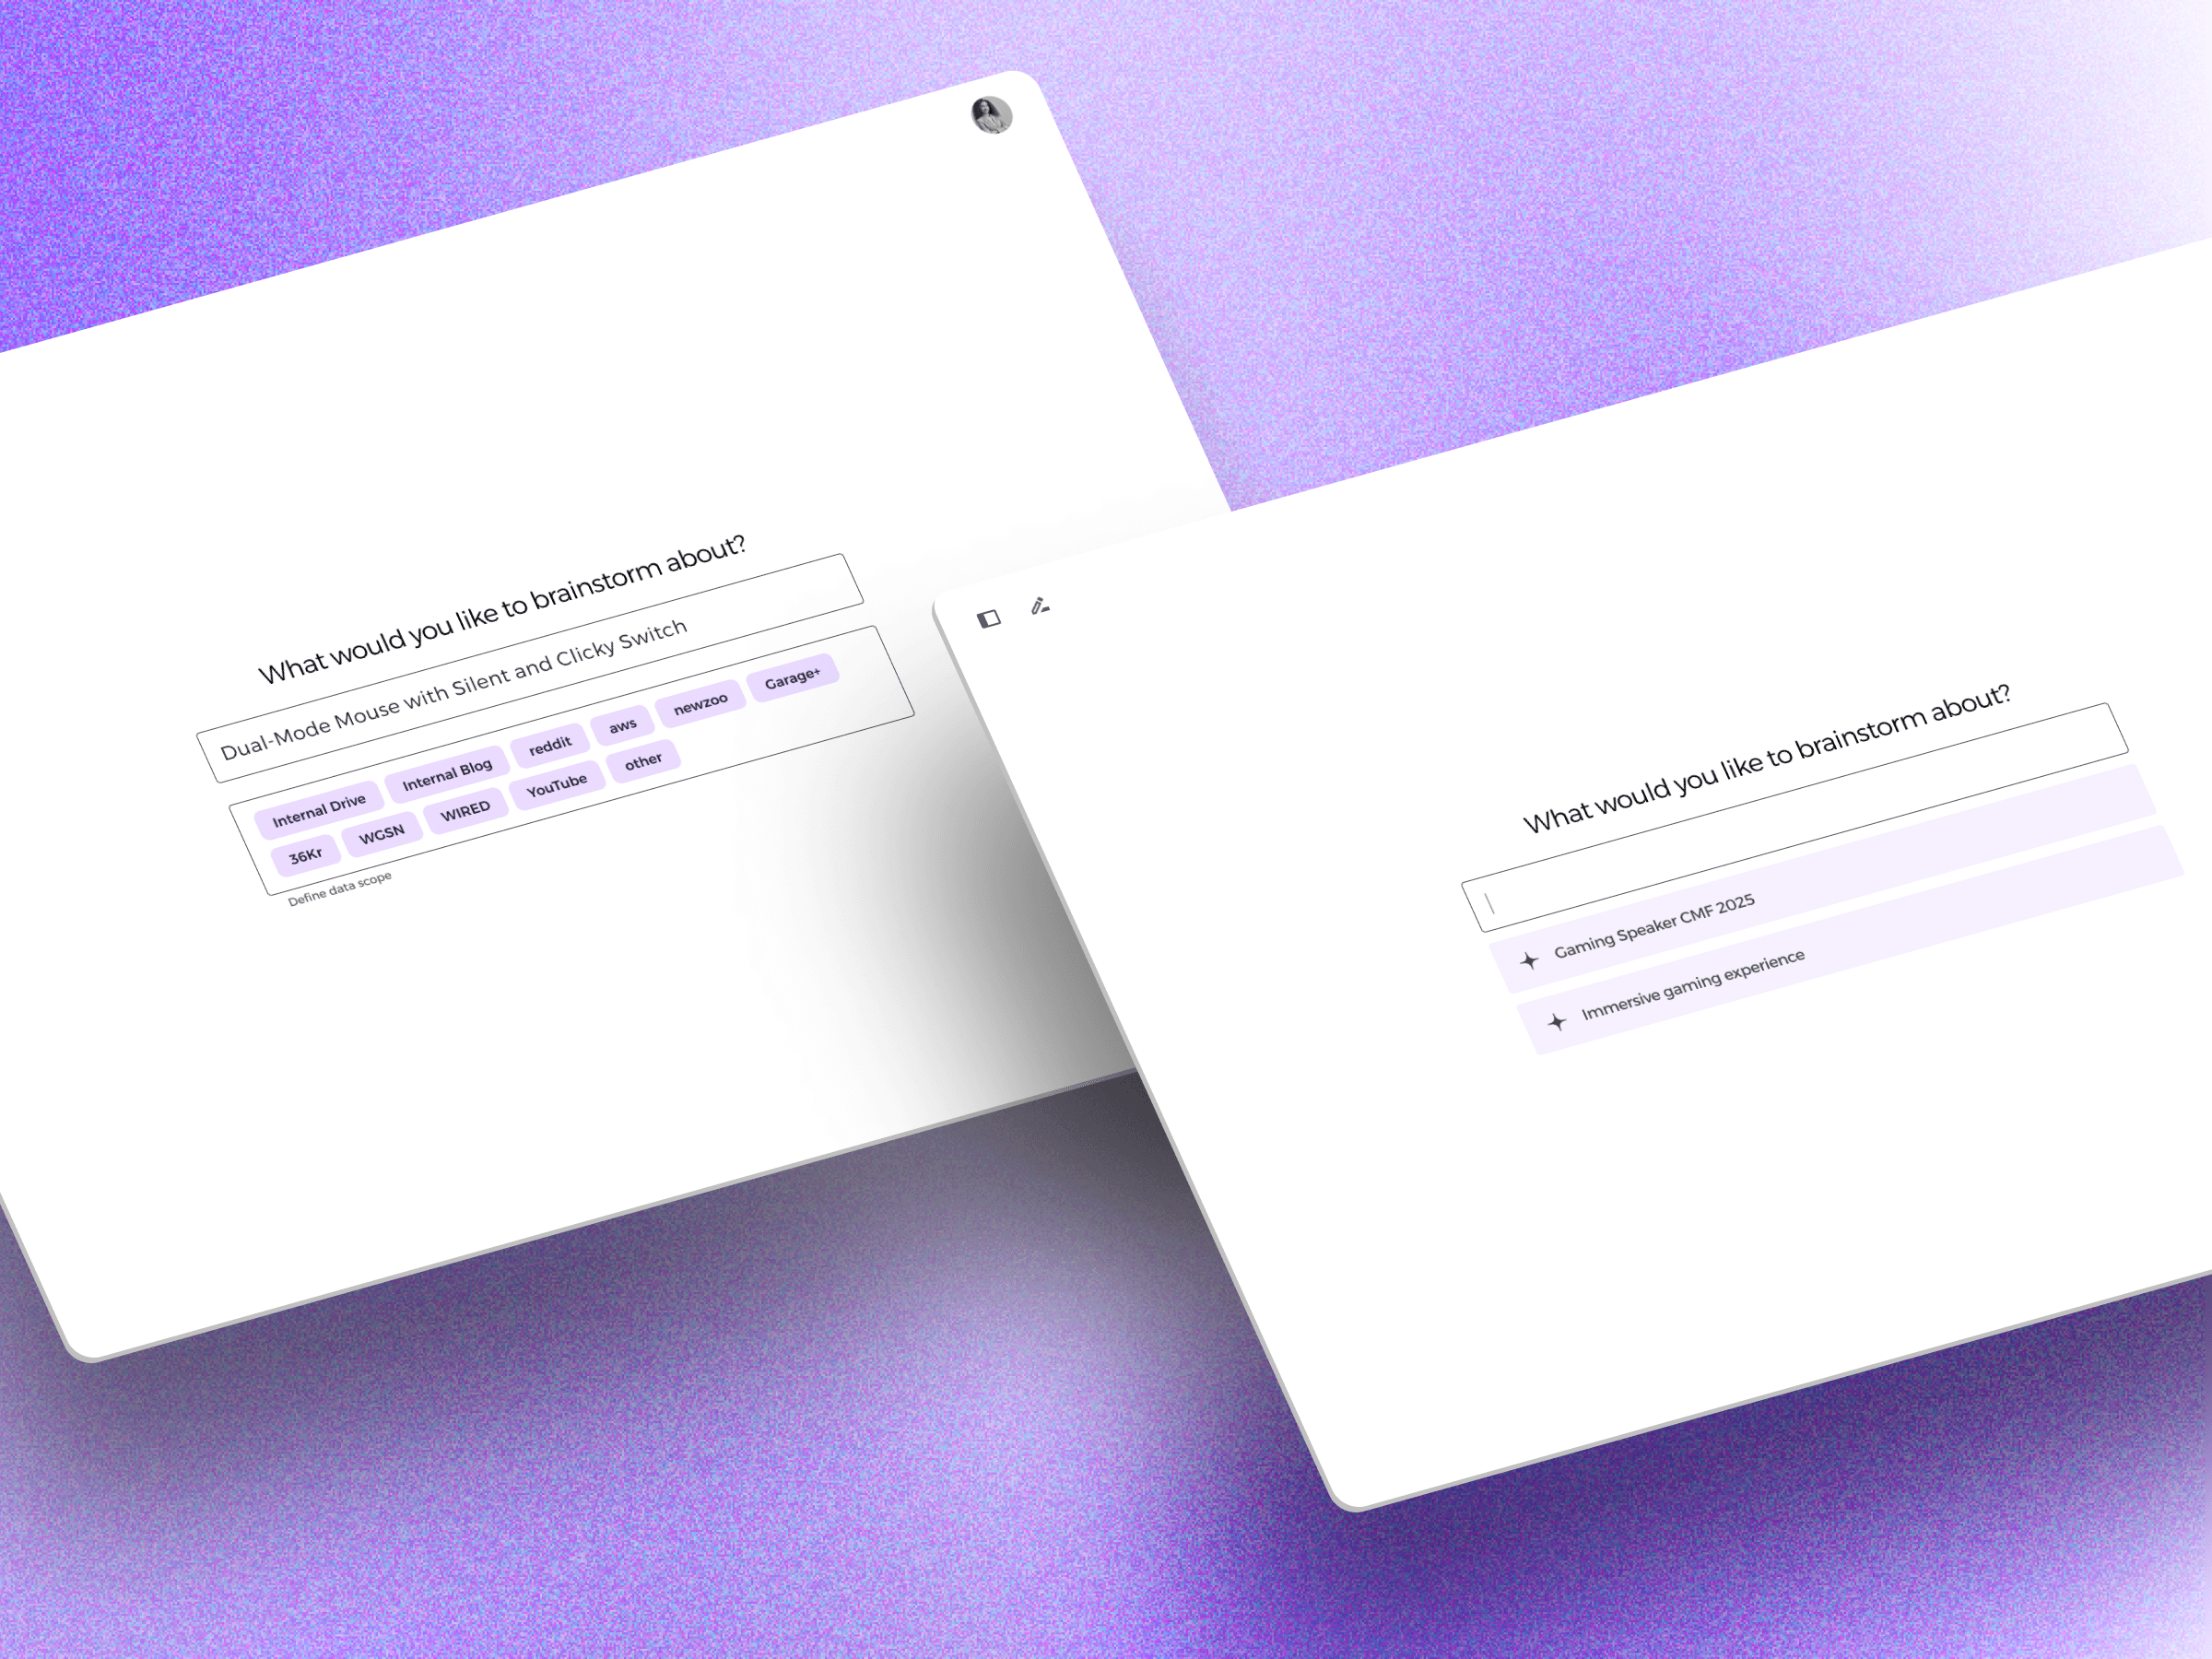
Data Scoping
Defining the right data scope directly impacts innovation outcomes. Our interface gives users control over which internal systems and external platforms contribute to their search, addressing a fundamental challenge in the innovation process: finding the sweet spot between proprietary knowledge and external perspectives. Search transforms from simple retrieval into strategic exploration by allowing users to create intentional collision spaces between selected sources.

Rapid AutoFetch
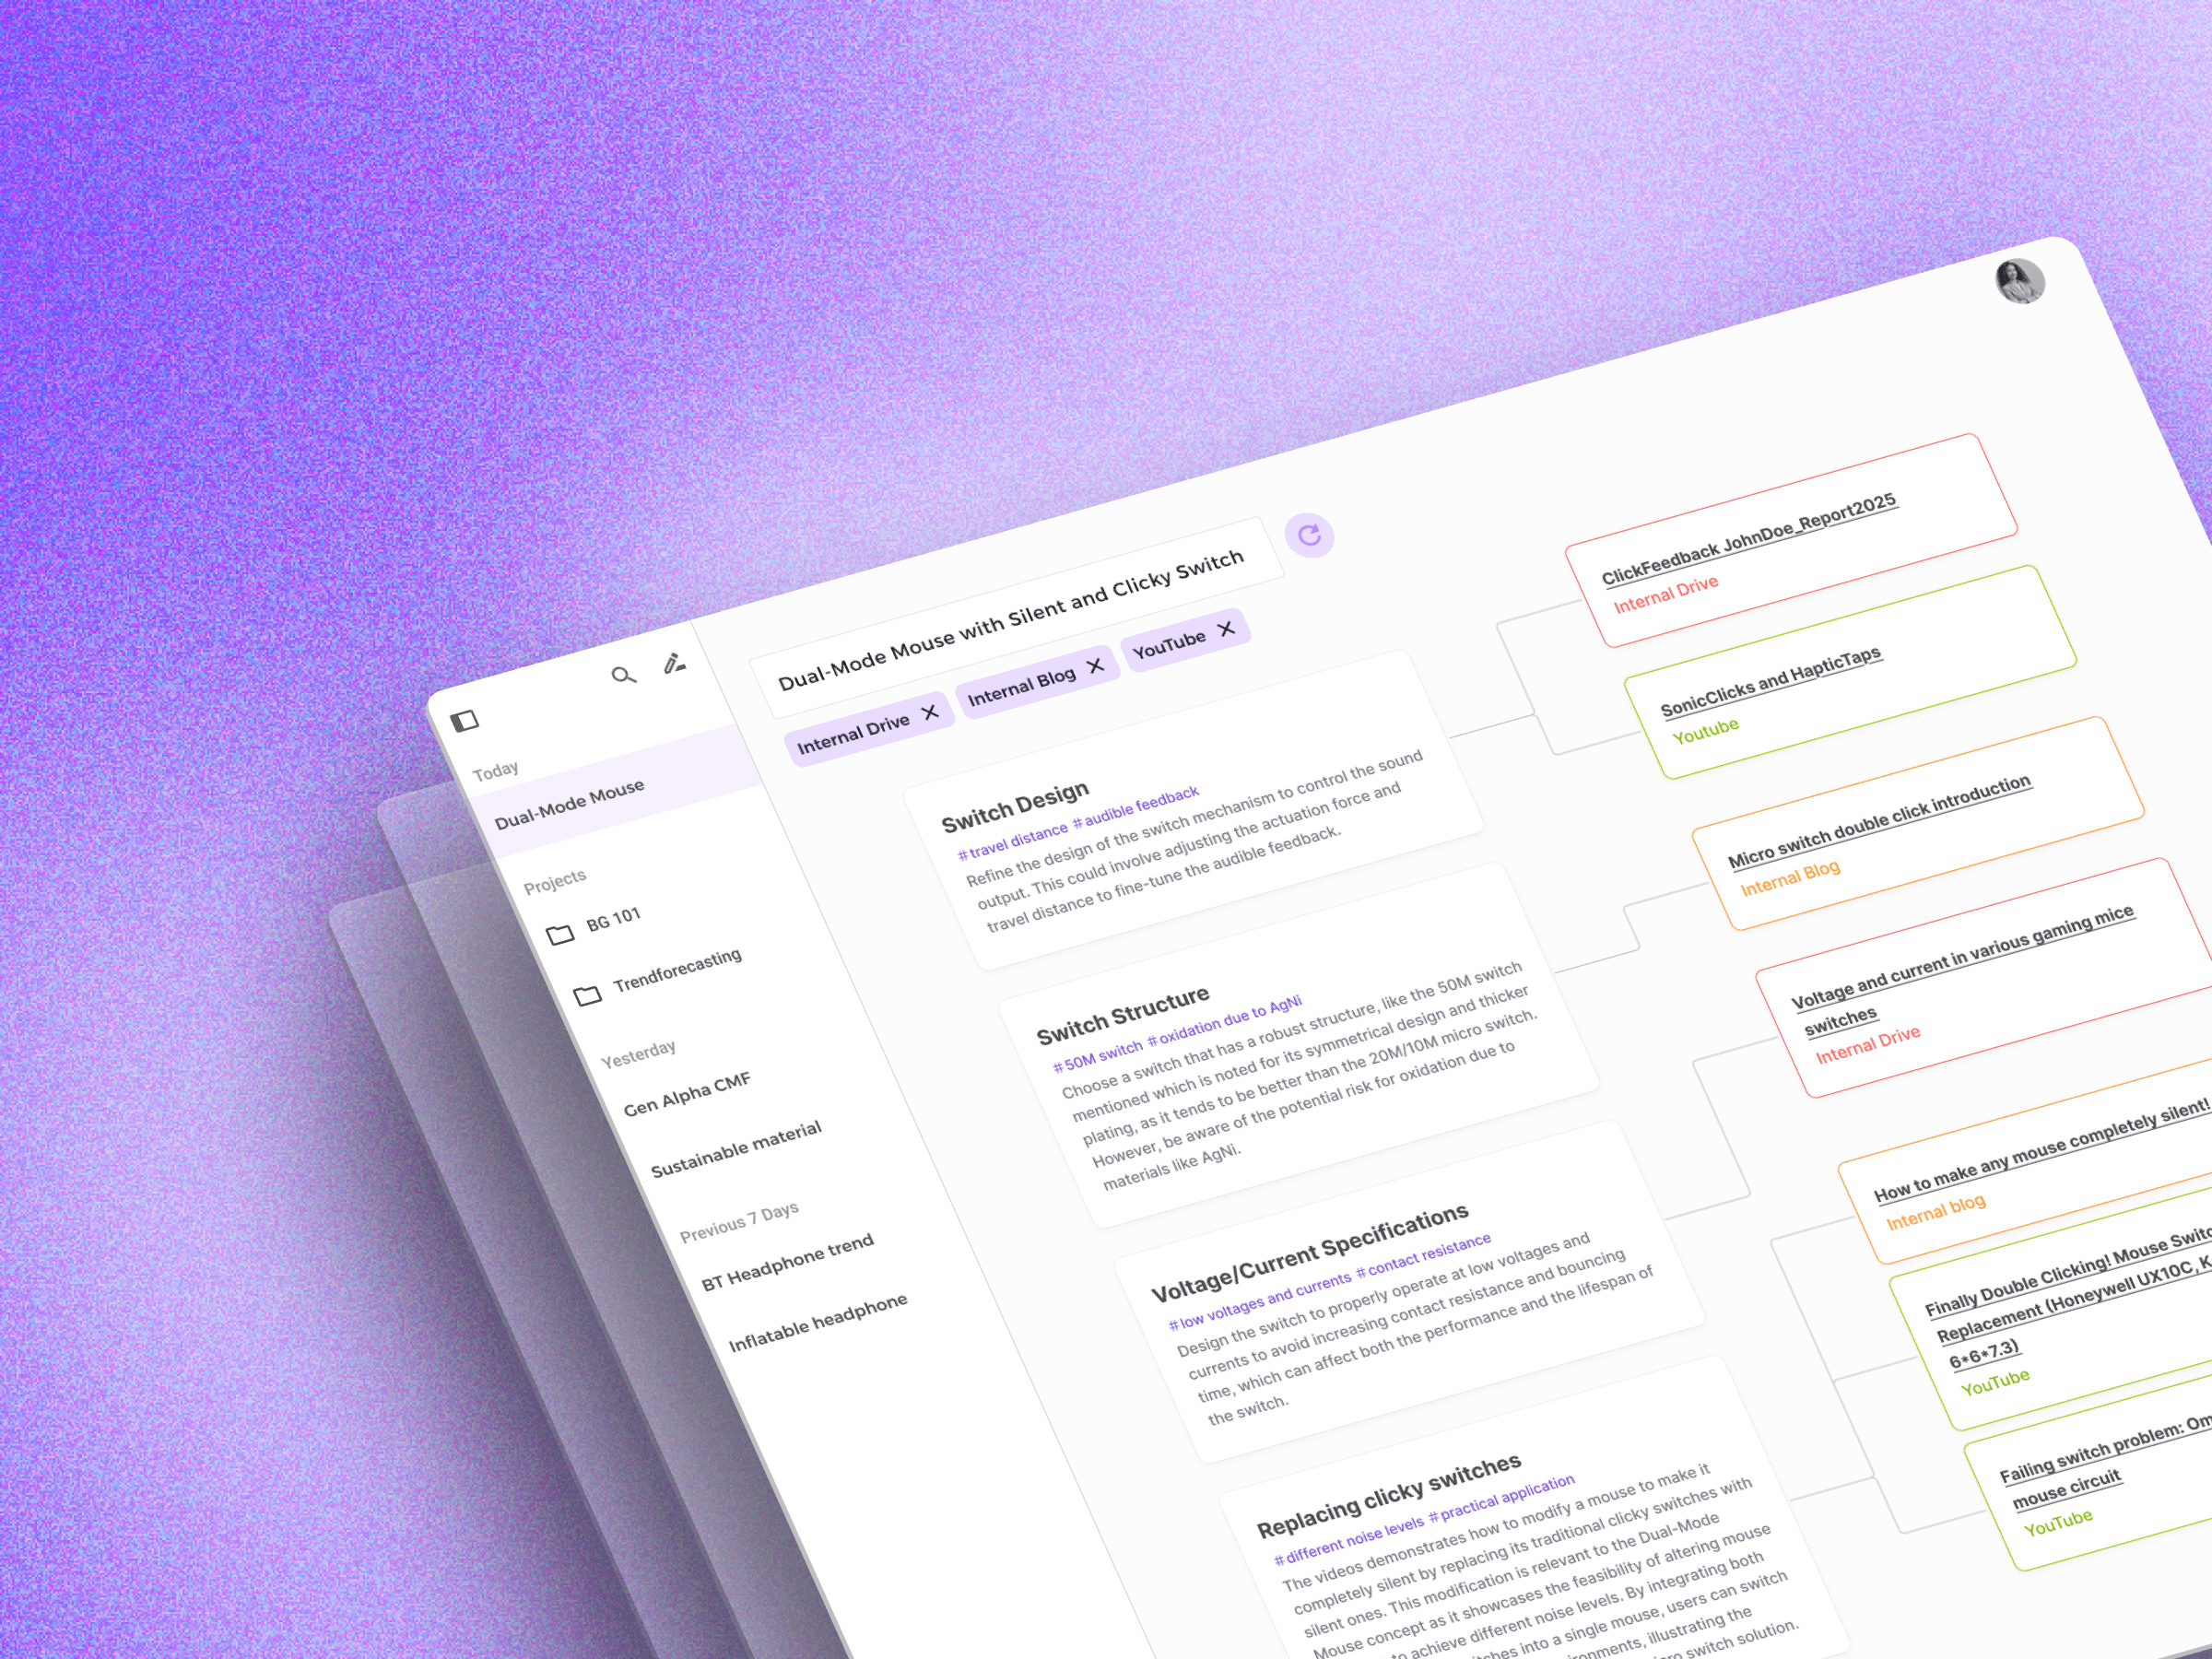
Accelerating data collection dramatically reduces innovation cycle time. Our system performs parallel processing across multiple sources simultaneously, addressing a critical bottleneck: the time-consuming gathering of information before analysis can begin. By automating discovery of connected resources, research transforms from sequential hunt into concurrent discovery. Our fetching algorithms identify relationships across repositories, revealing connections researchers might never manually discover. Visual indicators denote information sensitivity—red borders for highly confidential data, orange for restricted content, green for public information—ensuring awareness of security context during rapid exploration.

Thematic Insight Card Generation
Converting scattered research into structured knowledge themes accelerates innovation. Our system analyzes content across selected sources to automatically organize information into clear vertical topics—each with descriptive headings, relevant hashtags, and concise summaries that capture essential concepts. This organized thematic structure transforms what would be disconnected search results into a coherent knowledge landscape, revealing relationships between internal expertise and external developments that might otherwise remain undiscovered.
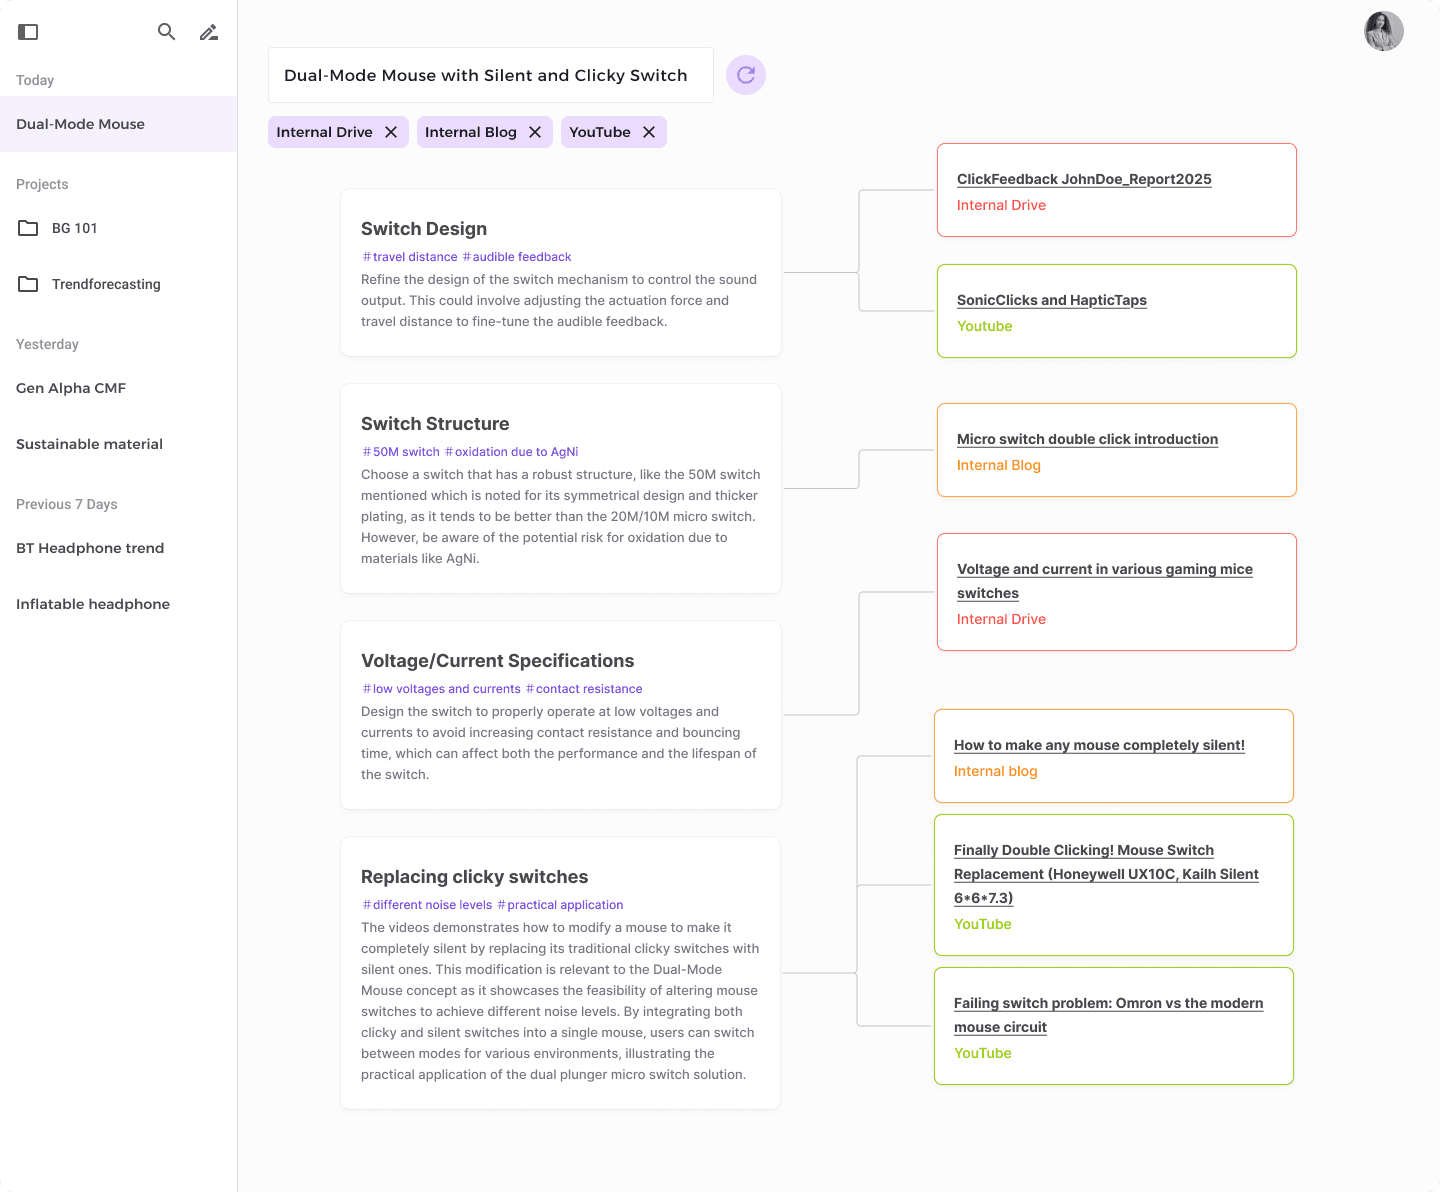
The interface presents a hierarchical view of key themes (like "Switch Design," "Switch Structure," "Voltage/Current Specifications") with visual connections to their original sources. Each insight card maintains clear source attribution through color-coding and labels (Internal Drive, Internal Blog, YouTube), allowing researchers to instantly understand both the content relevance and information security context in a single unified view.
How it works
Internal Data


External Data


LLM:
Security: Access Control, Secure Processing, and Compliance


Thematic Insight Generator
Hierarchical Topic Clustering
Cross-Source Relationship Mapping
Progressive Insight Summarization
AutoFetch Engine
Semantic Connection
Parallel Retrieval
Source Attribution Classifier
Insight Cards
Source Map
Challenges & Constraints
1. Balancing Complexity Simplification and Depth Retention
Designing a system that can handle a large number of data relationships while keeping the interface intuitive was our primary challenge. Through multiple rounds of testing, we gradually realized that what users truly need to understand is "how is each insight composed?" and "what data sources do these insights come from?" Therefore, we redefined the role of the relationship diagram, focusing its main function on presenting the compositional structure of insights and their source contexts, rather than displaying all relationships between all data.
We ultimately designed the Insight Card component: it presents insight summaries concisely on the interface, while embedding expansion options that allow users to explore more details as needed. This design strategy gives users the ability to control information depth independently. In subsequent testing, 94% of participants gave positive feedback, finding the design intuitive and easy to use, while providing sufficient detail.
2. Transitioning Users from Linear to Network Thinking
We found that users are accustomed to linear search tools (input keywords → get results list → filter), while traditional radial knowledge graphs are too abstract and difficult to navigate for most users. In early testing, users showed some cognitive load and usage barriers when faced with radial relationship diagrams.
Solution: Drawing inspiration from familiar document structures, we designed the "Vertical Hierarchical Relationship View":
Vertical Topic Arrangement: Main topics (such as "switch design," "switch structure," "voltage/current specifications") are arranged vertically, simulating the document or list browsing method familiar to users
Horizontal Relationship Display: Related resources and references connect to topics through horizontal connection lines, intuitively showing the relevance between information
Clear Source Identification: Each related resource is clearly marked with its source (such as internal hard drive, internal blog, YouTube, etc.), enhancing credibility
This design maintains the familiar top-down reading flow for users while introducing network thinking through lateral connections. By visualizing related resources as side branches rather than confusing central radial diagrams, we successfully lowered the learning threshold. User testing showed that compared to traditional knowledge graphs, this vertical hierarchical structure made it easier for users to understand the relationships between topics, while feeling the interface was more familiar and controllable.
Reflection
This experience not only confronted me with the technical and interactive challenges brought by AI systems but also forced me to rethink the essence of human-AI collaboration. Particularly in two key challenges—Capability Uncertainty and Output Complexity[1]—I experienced the limitations of traditional UX methods when facing AI, as well as the strategic role of designers in this context.
The unpredictability of AI tools, especially in early feature development and testing stages, often leads to gaps between design and implementation goals. Designers struggle to predict the boundaries of AI systems, making accurate judgments during requirement definition and user modeling stages difficult. This uncertainty made me realize that the designer's task is not merely to optimize the user interface, but to actively participate in "how to define what is designable"—a practice of meta-design. AI capabilities are not fixed; they evolve together with designers during the design process, making design an action of constantly exploring boundaries with technology and reconstructing possibilities.
On the other hand, the large amount of unstructured and highly variable outputs generated by AI also brings an unprecedented burden to design decisions. As I observed during the design process, output complexity not only increases users' cognitive load but also places new interpretive demands on the design interface: we no longer design to simplify options, but to design structures that help users "organize uncertainty"—a new framework for data stewardship. In such contexts, design is no longer about control, but harmony; not about reducing possibilities, but guiding understanding.
In summary, the most important thing I learned in the process of designing Claira was not how to operate a technical tool, but how to create possibilities for human users to participate, intervene, and understand within unstable knowledge and capability boundaries.
[1] Qian Yang, Aaron Steinfeld, Carolyn Rosé, and John Zimmerman. 2020. Re-examining Whether, Why, and How Human-AI Interaction Is Uniquely Difficult to Design. In Proceedings of the 2020 CHI Conference on Human Factors in Computing Systems (CHI '20). Association for Computing Machinery, New York, NY, USA, 1–13. https://doi.org/10.1145/3313831.3376301
